Economic Analysis

Figure 3 – P10, P50, and P90 C02 Price Trajectories [21]
In addition to narrowing our region of focus, we also decided that it would be necessary to further establish the economic aspects of carbon capture and sequestration projects within the proposed location. To this end, we agreed to research:
-
Price of CO2
-
Incentives for injection and storage
-
Cost of transportation of CO2
Price of CO2:
According to the Energy Information Agency (EIA), the price of CO2 “will be available at a cost from just under $1 to just over $3 per Mcf, delivered to the field.”
1,000 ft^3=0.0519 metric tons
We then convert from Mcf to metric tons, to reach a cost of $19 to $58 per ton of CO2. This is in agreement with the data provided by US Department of Energy’s National Energy Technology Laboratory which lists the price as $2 per Mcf, or about $38 per ton in March 2010.
It is important to note that the price of CO2 also typically correlates strongly to the price of oil, and since the downturn, the price of CO2 has likely fallen significantly. However, since there is currently little accessible information on the price of CO2 after 2014, we will continue to establish the most current price in our next deliverable.
Incentives for injection and storage:
Although there is no domestic carbon tax, there are domestic carbon subsidies with respect to the injection and storage of CO2. These subsidies are listed in the federal tax code (I.R.C. § 45Q). The specific subsidy we are interested in, for the use of captured carbon “as a tertiary injectant in a qualified enhanced oil or natural gas recovery project” is $10 per metric ton

[33]
Cost of transportation: The cost of transporting CO2 is a function of flow rate, volume, distance, and region. A detailed analysis of the cost of transportation will only be viable as we decide on a more specific location. With that being said, the average cost of transportation for CO2 is $3.65 per ton. Lower flow rates typically have a higher transportation cost in the range of $5 to $7 per ton. [16]
Exhaust Composition
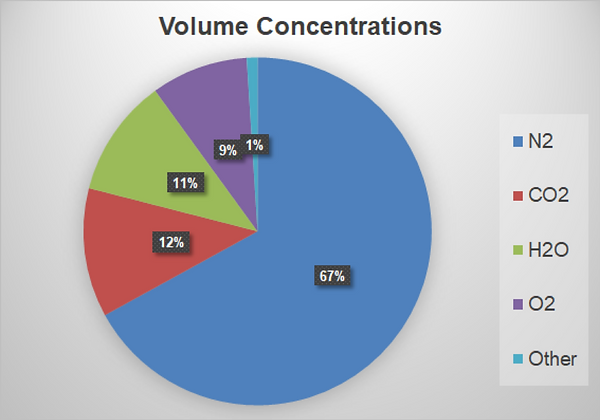
To create an accurate composition for the exhaust, we explored multiple sources of information to understand typical compositions of diesel exhausts. The pie chart below illustrates the volume concentration for each component. The 1% other includes: CO, HC, NOx, SO2 and particulate matter.
Exhaust Volumes
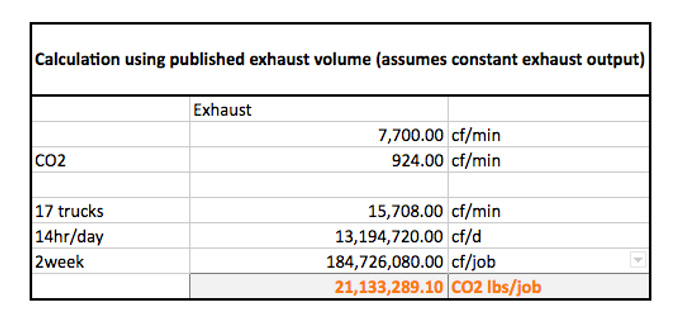
To calculate accurate exhaust volumes, we decided on 2 independent methods. First, we used the total volume of diesel fuel consumed to create an estimation of CO2 produced based on the weight of CO2 produced per gallon of fuel burned. Second, we estimated CO2 emissions using the flow rate, temperature, and pressure of the exhaust as listed in manufacturer information.
First Estimation: For the first estimation, we decided that our focus would be on the total fuel consumption of the trucks and engines, rather than a rate (such as gal/hr). Focusing on total consumption allowed us to be as accurate as possible by minimizing the number of assumptions we made.
We found the fuel consumption of large frac jobs to be upwards of 8,000 gallons of diesel fuel per day. According to the EIA, for each gallon of diesel fuel combusted 22.4 lbs of CO2 are released. This translates to 179,000 lbs/day of CO2.
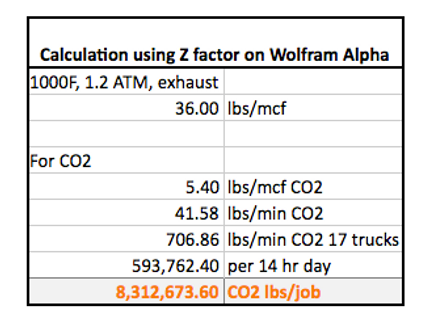
Second Estimation: For the second estimation, we used manufacturer specs, provided by Caterpillar, to find exhaust flow rate, pressure, and temperature (7700 cf/min, 2 atm, 1100℉ respectively). Using Wolfram Alpha, we performed a PVT calculation based on this information and the exhaust composition (referenced in the pie chart above) to get 17.99 lbs/ min of Co2 exhausted. However, this value assumes constant flow rate at max load, which is not realistic. As shown in the following table which evaluated the load rate of a pump engine for a specific frac job, the maximum load was used only 5% of the time. We used this data to calculate a weighted average of CO2 mass flow rate, 8.5 lbs/min for each pump.
Then, if we assume that a typical large-scale frac site consists of 20 trucks that work for 14 hours a day, this equates to 142,000 lbs/day of exhausted CO2.
Calculations


Table 1: Distribution of Engine Loads from Frac Pumps

